
Global Energy Import Dependence Set to Peak by 2034, Rystad Says | OilPrice.com
Rystad Energy
Rystad Energy is an independent energy consulting services and business intelligence provider offering global databases, strategic advisory and research products for energy companies and suppliers,…
Trending Discussions
Premium Content
By Rystad Energy – Oct 16, 2026, 5:00 PM CDT
- Global reliance on imported energy peaks by 2034, and import dependence among importing countries drops from about 40% today to 26% by 2050 in Rystad’s new Pragmatism scenario.
- Nearly 100 countries have shielded consumers from the Hormuz shock since February, but 26 have also adopted electrification policies, and electricity’s share of useful energy is set to climb from 28% to 41% by 2050.
- Chinese EVs, batteries and solar gear are filling the gap left by Gulf supply, and China’s hold on key clean-tech segments, from 78% of battery cells to 96% of solar wafer capacity, is deepening importers’ dependence.
Rystad Energy’s fifth edition of its flagship annual report, Global Energy Scenarios (GES) 2026, finds that global reliance on imported energy is projected to peak by 2034 as energy security concerns accelerate the shift towards electrification. Against the backdrop of two major energy crises in five years, the report highlights how a broader range of rapidly deployable technologies is helping the energy system withstand major disruptions to energy flows. It explores how energy import dependency could evolve under three possible future scenarios, each reflecting a different pace of change.
Russia’s war in Ukraine and the US-Israeli war with Iran, which has severely affected flows through the Strait of Hormuz, are among the most severe tests of the energy system since the oil crises of the 1970s. Both had long been considered major risks, but they played out differently than anticipated.
Much of the system’s resilience thus far comes from energy capacity built after the first shock. In 2021, Russia supplied around 36% of Europe’s gas imports and the US around 6%. By 2025, Russia was down to around 7.5% while US LNG supplied around 21%. That infrastructure is now helping buffer the system, although Europe and Asia are competing for the same LNG cargoes, which risks leaving Europe short of winter stocks and Asia short of supply. For oil, pipelines, crude on water, storage and demand response have done much of the work, most visibly in China. The two conflicts also overlap in diesel: Ukrainian strikes on Russian refineries have pushed Moscow to ban diesel exports just as Hormuz has reduced Middle East supply. With diesel stocks around 14% below their five-year average, US diesel cracks have climbed above a record $100 per barrel, raising costs for trucking, shipping and freight.
Governments protect consumers first, then turn to structural change
Since February 2026, nearly 100 countries have cut fuel taxes, paid subsidies or capped prices to shield consumers, 60 have introduced demand-reduction measures and 34 have pursued structural changes. Of those, 26 adopted electrification policies, 22 of them in Europe and Asia. Energy security is making electrification more politically durable, including in countries such as Italy and Japan that had placed relatively less emphasis on sustainability. Most countries are electrifying with domestic energy: renewables and nuclear where available, and coal where reserves exist. Little new coal capacity is being built, but plant life extensions, restarts and delayed phaseouts, including Italy to 2038 and Thailand’s Mae Moh, add years of emissions.
The system has absorbed the current crisis remarkably well so far, much of it through capacity built after the previous shock. Decades of investment, innovation and diversification created this optionality and, with ample buffers at the onset of the crisis, this has bought the system valuable time. How much remains depends on how long the Strait of Hormuz stays constricted and how fast new options can materialize. The longer the conflict lasts, the harder it will affect interlinked systems like food, logistics and manufacturing,
Jarand Rystad, Founder & Executive Chairman, Rystad Energy
Pragmatism: a new reference pathway to 2050
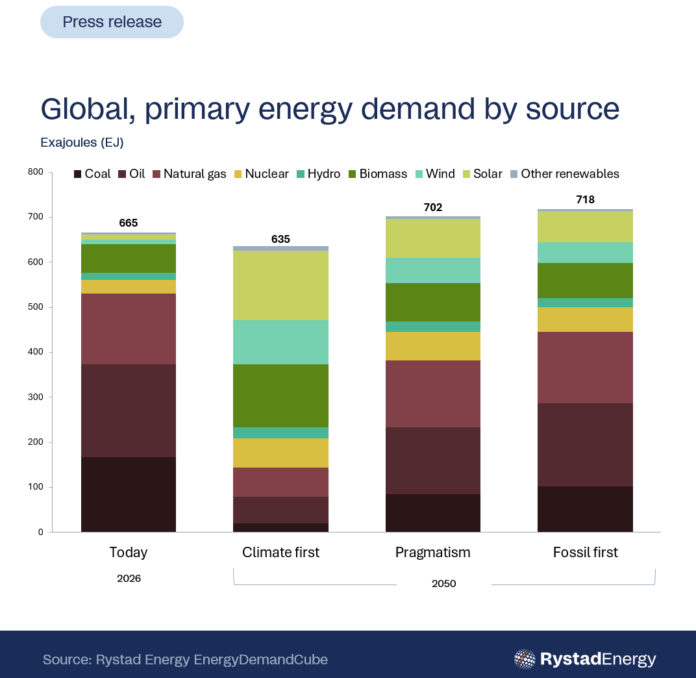
The report introduces Pragmatism as a new reference scenario to 2050. It assumes a gradual strengthening of current policies, with affordability, energy security and technology costs setting the pace. It reflects a shift away from a transition driven mainly by stringent climate policy toward one that balances reliable, affordable and clean energy. Climate first, which assumes rapid and coordinated global action, and Fossil first, which assumes weaker policy support and slower clean-technology progress, bracket the range.
Learn more with Rystad Energy’s Energy Macro solution.
Under Pragmatism, primary energy demand reaches 702 exajoules (EJ) by 2050, equivalent to adding another India to global energy demand in less than 25 years. Liquids demand declines about 2.2% per year to 102 million bpd in 2026, and gas demand about 0.9% per year to 4,150 billion cubic meters. Oil and gas trade grows into the mid-2030s and stays above today’s level until 2043. Middle East exports hold near current levels through 2050, and Europe and Asia still import around 76% and 49% of their gas, respectively. Import dependence among importing countries falls from around 40% today to 26% by 2050 in Pragmatism, compared with 33% in Fossil first and 14% in Climate first.
Each pathway involves trade-offs. Fossil first costs less upfront because it avoids the capital needed for electrification, while Climate first front-loads investment, at an average of $3.8 trillion per year from 2026 to 2050, compared with $2.9 trillion in Pragmatism and $2.3 trillion in Fossil first. For net importers, Climate first capex peaks at $3.1 trillion in 2037 and then falls to $1.1 trillion by 2050, below Fossil first. The cost gap narrows after 2040 as fuel bills fall and clean technologies scale.
Electricity moves to the center of the system
Electricity overtook oil in 2025 as the largest carrier of useful energy for direct fuel use, and its share is projected to rise from around 28% today to 41% by 2050 under Pragmatism. By midcentury, electricity supplies more useful energy than coal, oil and gas combined. Primary energy demand among importers peaks in 2038 at 421 EJ, yet the energy they put to work grows 22% through 2050 because electric end uses lose less energy than combustion. Electricity is now linked to about 47% of global gross domestic product (GDP), up from 38% in 2000, with China’s share up 28 percentage points to 48%.
Artificial intelligence adds a different kind of pressure. It is felt most in local power markets and grids, where data centers outbid existing customers, strain the supply of gas-fired generation equipment and fill order books for gas turbines and fuel cells. In the US, data centers lean largely on gas for the firm power they need first. Nuclear has returned to the agenda, with Asia moving fastest and data centers contracting it directly.
Whichever mix countries choose, the common denominator is electricity. Established technologies continue to get cheaper, while newer ones, from long-duration heat storage to new battery chemistries, approach commercialization.
China’s clean-technology exports grow as importers look
Source: oilprice.com — article syndicated from the publisher’s feed; all rights remain with the original publisher.

