
Key Takeaways
- Enbridge yields 6.0% and raised its dividend 3.1% a year from fiscal 2020 to fiscal 2025. TC Energy yields 4.2% and raised its dividend 1.0% a year over the same years.
- TC Energy’s distributable cash flow covered its dividend 1.96x in fiscal 2025, against 1.51x for Enbridge.
- TC Energy’s dividend per share fell from C$3.70 in fiscal 2024 to C$3.40 in fiscal 2025. Enbridge declared its 31st consecutive annual increase in December 2025.
- Enbridge’s debt-to-EBITDA was 5.1x at the end of June 2026, and the company expects it to be back within its 4.5x to 5.0x target range by the end of 2026.
Anyone hunting for a big dividend check from North American pipelines is going to look hard at Enbridge (ENB) and TC Energy (TRP).
On Dec. 3, 2025, Enbridge raised its quarterly dividend 3% to C$0.97 a share, its 31st consecutive annual increase. TC Energy’s comparable EBITDA grew 12% in the second quarter of 2026 from a year before, and it’s now targeting the upper end of its 2026 outlook.
Both pay in Canadian dollars, and a US holder’s check moves with the exchange rate. Canada also withholds tax on dividends paid to US holders. Both are judged on distributable cash flow coverage.
So which is the better dividend stock?
MetricEnbridge (ENB)TC Energy (TRP)Dividend yield6.0%4.2%Dividend growth, fiscal 2020–20253.1% a year1.0% a yearDividend growth, fiscal 2015–20257.3% a year5.0% a yearDistributable cash flow coverage, fiscal 20251.51×1.96xDistributable cash flow coverage, fiscal 2026 consensus1.50×1.83xNet debt/EBITDA (LTM)6.3×6.1xInterest coverage, EBIT/interest (LTM)2.3×2.1xSource: TIKR, Oct. 7, 2026
Enbridge: a raise every year, on coverage that barely moves
In the second quarter of 2026, Enbridge’s adjusted EBITDA rose to C$4.8 billion from C$4.6 billion a year before. Distributable cash flow held at C$2.9 billion.
Gas transmission, the gas utilities and renewables are all growing segments.
Management expects about 5% average annual growth after 2026, backed by a secured project backlog of about C$41 billion. As CEO Greg Ebel put it: “We will continue to add visibility to, and extend, our 5% growth outlook further into the future.”
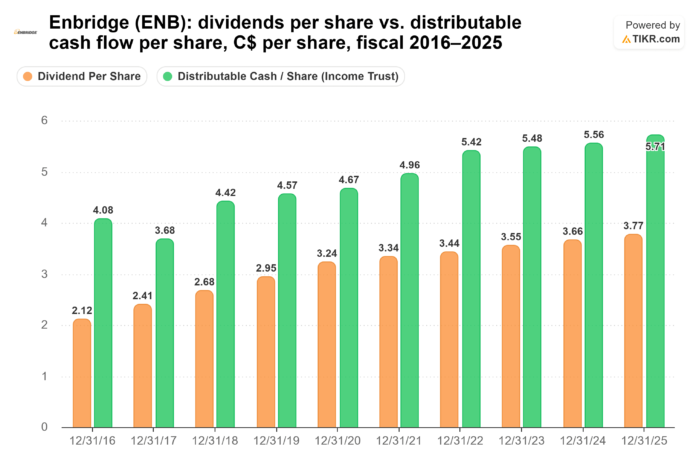
Enbridge says it uses DCF to set its dividend payout target, and the record matches. Its dividend rose every year from C$2.12 a share in fiscal 2016 to C$3.77 in fiscal 2025. Over the same years, distributable cash flow per share grew from C$4.08 to C$5.71, which kept coverage between 1.44x and 1.92x the whole way.
Enbridge (ENB): dividends per share vs. distributable cash flow per share, C$ per share, fiscal 2016–2025 (TIKR)
Analysts expect a comfortable 1.50x for fiscal 2026: C$5.83 of DCF per share against C$3.88 of dividends.
The risk is debt: Enbridge’s own debt-to-EBITDA measure was 5.1x at the end of the second quarter of 2026, above its 4.5x to 5.0x target range.
TC Energy has more room, and a bumpier record
Enbridge’s case rests on consistency. TC Energy’s rests on the room its dividend has.
Its distributable cash flow covered the dividend a wide 1.96x in fiscal 2025. Analysts expect 1.83x for fiscal 2026: C$6.43 of DCF per share against C$3.51 of dividends.
TC Energy targets 2028 comparable EBITDA of C$12.6 billion to C$13.1 billion, about 6% annualized growth at the midpoint from 2025. It has also tied its growth spending to its balance sheet. As CFO Sean O’Donnell said: “We remain committed to maintaining the balance sheet strength and our 4.75x leverage target, and we will continue to execute projects with excellence.”
The record behind that 1.96x is bumpier, though. TC Energy’s dividend rose from C$2.26 a share in fiscal 2016 to C$3.72 in fiscal 2023, then slipped to C$3.70 in fiscal 2024 and C$3.40 in fiscal 2025. Coverage slid from 2.36x in fiscal 2018 to a thin 1.23x in fiscal 2024. Then distributable cash flow per share jumped from C$4.56 to C$6.68 in fiscal 2025.
TC Energy (TRP): dividends per share vs. distributable cash flow per share, C$ per share, fiscal 2016–2025 (TIKR)
The fiscal 2025 drop in the dividend is the main risk here. It’s why TC Energy’s five-year growth rate is just 1.0% a year.
So which dividend wins?
Enbridge is the better dividend stock. It pays the bigger check, has raised it faster, and covers it on a margin that’s barely moved.
Put $10,000 in Enbridge at its 6.0% yield, and it pays $600 a year today. Growing at its 3.1% five-year rate, that’s about $788 in year 10.
The same $10,000 in TC Energy pays $420 now, and about $458 in year 10 at its 1.0% rate. At these rates, its income never catches up to Enbridge’s.
This isn’t to say TC Energy’s dividend is in trouble. Its fiscal 2025 coverage is the wider of the two, and its business is growing. It’s just that Enbridge has done what income investors want most. It has raised the check 31 years running, on coverage between 1.49x and 1.58x in each of the last five fiscal years.
Of course, Enbridge’s debt still has to come back inside its target range by the end of 2026, as management expects. That’s the number to watch before its next raise.
So what is Enbridge stock actually worth?
TIKR lets you forecast the future price of any stock in less than a minute. Just enter a few assumptions into TIKR’s valuation model and see what Enbridge could be worth. Start from Wall Street consensus estimates, or adjust the inputs to reflect your own view of the business. It’s free to use.
Disclaimer:
Please note that the articles on TIKR are not intended to serve as investment or financial advice from TIKR or our content team, nor are they recommendations to buy or sell any stocks. We create our content based on TIKR Terminal’s investment data and analysts’ estimates. Our analysis might not include recent company news or important updates. TIKR has no position in any of the stocks mentioned. Thank you for reading, and happy investing!
Source: www.tikr.com — article syndicated from the publisher’s feed; all rights remain with the original publisher.

