
Key Takeaways
- Enbridge yields 6.0% and Duke Energy 3.8%, after raises of 3% in December 2025 and 2% in July 2026.
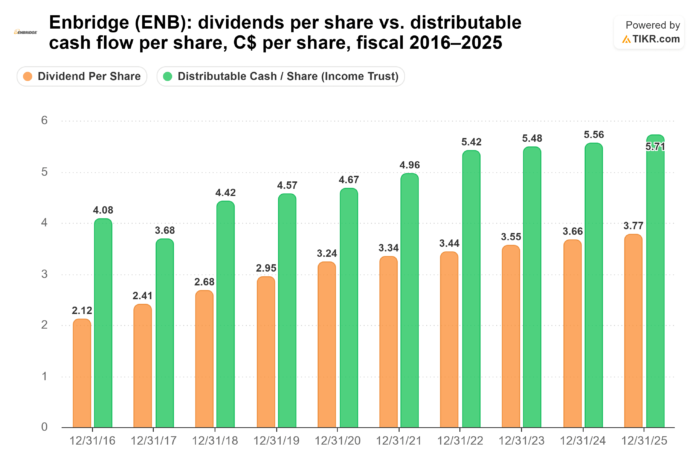
- Enbridge’s distributable cash flow covered its dividend 1.51x in fiscal 2025, and analysts expect 1.50x in fiscal 2026.
- Duke Energy paid out 67% of its normalized EPS in fiscal 2025, down from 76% in fiscal 2022, and guides to 5% to 7% yearly EPS growth through 2030.
- Enbridge carries more debt, with net debt at 6.3x EBITDA against Duke’s 5.4x, and it pays its dividend in Canadian dollars.
Retirees who live off their dividends want a big check, and one they can count on year after year.
Enbridge (ENB) writes the bigger one, yielding 6.0% after its 31st straight annual raise in December. Duke Energy (DUK) yields 3.8%, and in July it raised its dividend again, extending a run of annual increases it puts at over 20 years.
So which one belongs in a retiree’s portfolio?
MetricEnbridge (ENB)Duke Energy (DUK)Dividend yield6.0%3.8%Dividend growth, fiscal 2020 to fiscal 20253.1% a year2.0% a yearRecord (company’s own count)31 straight annual raisesOver 20 years of annual raisesCoverage, fiscal 20251.51x distributable cash flow67% of normalized EPSCoverage, fiscal 2026 consensus1.50x distributable cash flow65% of normalized EPSNet debt/EBITDA (LTM)6.3×5.4xSource: TIKR, Oct. 7, 2026; company releases and earnings calls for the records
Enbridge: 31 raises and counting
In December 2025, Enbridge raised its quarterly dividend 3% to C$0.97 a share (C$3.88 a year). Distributable cash flow covers it comfortably: C$5.71 a share in fiscal 2025 against C$3.77 in dividends, or 1.51x. Analysts expect 1.50x for fiscal 2026.
The cushion has held steady for years. Coverage fell from 1.92x in fiscal 2016 to 1.55x in fiscal 2019. It has stayed between 1.44x and 1.58x every year since.
Enbridge (ENB): dividends per share vs. distributable cash flow per share, C$ per share, fiscal 2016–2025 (TIKR)
The cash flow is still growing. In July, Enbridge reaffirmed its fiscal 2026 guidance of C$5.70 to C$6.10 a share in distributable cash flow, and it expects about 5% a year growth after 2026.
Debt is the catch. Enbridge’s own debt-to-EBITDA measure was 5.1x at the end of June, above its 4.5x to 5.0x target range. It expects to end 2026 back inside the range.
US retirees should know that Enbridge sets its dividend in Canadian dollars. The US-dollar check ($2.79 a share a year at today’s rate) moves with the currency, and Canada withholds tax on dividends paid to US holders.
At its 6.0% yield, $10,000 pays $600 a year today. At its 3.1% rate, that would be about $788 in year 10, a 7.9% yield on the original $10,000.
Duke Energy has room to raise faster
Duke Energy’s check is smaller, but it comes in US dollars, and the earnings behind it are growing faster than the dividend. As a utility that funds its construction with debt and stock, Duke is judged on earnings. It paid out 67% of its normalized EPS in fiscal 2025 ($4.22 against $6.31), and analysts expect 65% for fiscal 2026.
That ratio has fallen for three years in a row. Normalized EPS grew from $5.27 in fiscal 2022 to $6.31 in fiscal 2025, while the dividend rose from $3.98 to $4.22.
Duke Energy (DUK): dividends per share vs. normalized EPS, $ per share, fiscal 2016–2025 (TIKR)
More earnings growth is on the way. In August, Duke reaffirmed 2026 adjusted EPS guidance of $6.55 to $6.80 and expects 5% to 7% a year growth through 2030. It has 7.8 gigawatts of signed agreements with data center customers behind that plan.
Shareholders aren’t getting much of that growth yet, though. The July raise was 2%, which management called consistent with its raises in recent years.
At its 3.8% yield, $10,000 pays $380 a year today. At its 2.0% rate, that would be about $455 in year 10. Call it a 4.5% yield on your cash today.
So which dividend wins?
For a retiree living off dividends, Enbridge is the better dividend stock. It pays the bigger check today: $600 a year on $10,000, against $380 at Duke. Its dividend has also grown faster, at 3.1% a year from fiscal 2020 to fiscal 2025 against Duke’s 2.0%. At those rates, Duke’s income never catches up.
Duke Energy makes a strong case of its own. Its check comes in US dollars, with no foreign tax taken out, and it carries less debt, at 5.4x net debt to EBITDA against Enbridge’s 6.3x. With its payout ratio down to 67% and EPS guided to grow 5% to 7% a year, Duke has plenty of room to keep raising. It’s just that, when it comes down to it, I’d rather collect a bigger check that’s also growing faster, from a company that has raised it for 31 years straight.
Of course, Enbridge’s debt is still above its own target, and management expects it to come down only as new projects enter service. That’s the number to watch over the next couple of years.
So what is Enbridge stock actually worth?
TIKR lets you forecast the future price of any stock in less than a minute. Just enter a few assumptions into TIKR’s valuation model and see what Enbridge could be worth. Start from Wall Street consensus estimates, or adjust the inputs to reflect your own view of the business. It’s free to use.
Disclaimer:
Please note that the articles on TIKR are not intended to serve as investment or financial advice from TIKR or our content team, nor are they recommendations to buy or sell any stocks. We create our content based on TIKR Terminal’s investment data and analysts’ estimates. Our analysis might not include recent company news or important updates. TIKR has no position in any of the stocks mentioned. Thank you for reading, and happy investing!
Source: www.tikr.com — article syndicated from the publisher’s feed; all rights remain with the original publisher.

