
Key Takeaways
- Enterprise Products Partners reported record second-quarter operational distributable cash flow of $2.3 billion, up 21% from a year earlier, and ONEOK raised its 2026 adjusted EBITDA guidance.
- The choice comes down to Enterprise’s 6.1% yield against ONEOK’s 4.9% yield, which has more cash behind it.
- Enterprise’s distributable cash flow covered its distributions 1.69x in fiscal 2025, against 2.25x at ONEOK, which carries more debt.
- The thing to watch is whether ONEOK uses its wider coverage to raise its dividend faster than the 2.0% a year it averaged from fiscal 2020 to fiscal 2025.
Enterprise Products Partners (EPD) just had a record quarter. Its operational distributable cash flow rose 21% from a year earlier to $2.3 billion in the three months to June 30, 2026. That covered its distribution 1.9x.
ONEOK (OKE) raised its 2026 guidance a few days later. In August, it announced an acquisition that it says speeds up its debt paydown and gives it more room for potential dividend increases.
Both are pipelines, so each dividend is judged on its distributable cash flow coverage. Enterprise pays the bigger yield, and ONEOK has more cash behind each dollar it pays. For income investors, the question is which one pays you more over the next 10 years.
MetricEnterprise Products Partners (EPD)ONEOK (OKE)Dividend yield6.1%4.9%Current dividend$2.24 a unit a year$4.28 a share a yearDividend growth, fiscal 2020–20254.0% a year2.0% a yearDistributable cash flow coverage, fiscal 20251.69×2.25xDistributable cash flow coverage, fiscal 2026 consensus1.89×2.25xNet debt/EBITDA (last twelve months)3.2×4.28xInterest coverage (last twelve months)5.03×3.46xSource: TIKR, Oct. 7, 2026; current dividends from StockAnalysis
Enterprise keeps the raises coming
Enterprise is a partnership, so it pays distributions on units, and unitholders get a K-1 at tax time.
The business behind that check is growing. In the second quarter of 2026, equivalent pipeline volumes rose 8% from a year earlier to a record 14.7 million barrels a day.
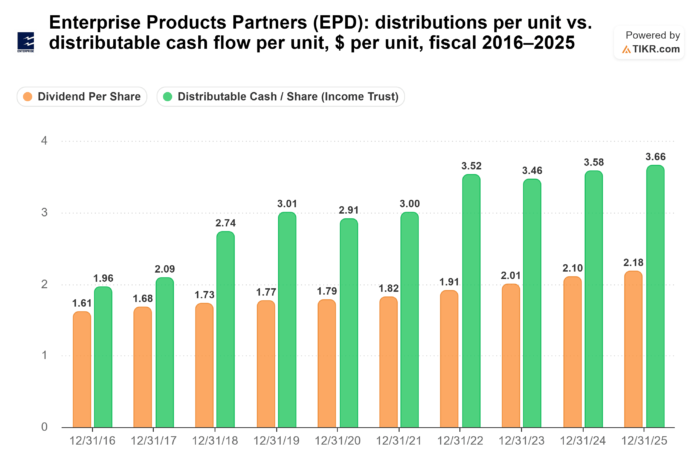
On its April call, management said, “we think distributions to partners will grow commensurate with operational distributable cash flow per unit growth.” The record bears that out. Distributions rose every year from $1.61 a unit in fiscal 2016 to $2.17 in fiscal 2025. Over the same years, distributable cash flow per unit climbed from $1.96 to $3.66, and coverage went from 1.22x to a comfortable 1.69x…
Enterprise Products Partners (EPD): distributions per unit vs. distributable cash flow per unit, $ per unit, fiscal 2016–2025 (TIKR)
…and analysts expect 1.89x in fiscal 2026, on $4.24 a unit of distributable cash flow against $2.24 paid out. Management says Enterprise is “on track for 28 consecutive years of distribution growth in 2026.”
Growth spending is the main call on the cash left over, expected at $2.9 billion to $3.4 billion in 2026, net of asset sales. Management still sees 2026 discretionary free cash flow approaching the $1 billion area.
ONEOK has the wider cushion
Next to Enterprise, ONEOK pays a smaller check with a wider cushion under it. Management raised its 2026 adjusted EBITDA guidance midpoint by $250 million, to $8.35 billion.
Distributable cash flow per share rose from $3.20 in fiscal 2016 to $9.25 in fiscal 2025. Over the same years, the dividend went from $2.46 to $4.12, though it held at $3.74 from fiscal 2020 through fiscal 2022…
ONEOK (OKE): dividends per share vs. distributable cash flow per share, $ per share, fiscal 2016–2025 (TIKR)
…which leaves a wide 2.25x coverage in fiscal 2025. Analysts see the same 2.25x in fiscal 2026, on $9.69 a share against $4.31 paid out.
Debt is the weak spot. Over the last twelve months, ONEOK’s net debt ran 4.28x EBITDA, against 3.2x at Enterprise, and its EBIT covered interest 3.46x, against Enterprise’s 5.03x. ONEOK says its August deal lets it retire about $5 billion of debt, bringing its pro forma 2027 leverage to about 3.25x debt-to-EBITDA.
So which dividend wins?
Enterprise Products Partners pays you more over the next 10 years. At its 6.1% yield, $10,000 pays $610 a year today. If that grows at Enterprise’s 4.0% five-year rate, it reaches about $871 in year 10. That’s about $7,338 in all. The same $10,000 in ONEOK pays $490 now and about $5,354 over the decade at its 2.0% rate. That leaves Enterprise about $1,984 ahead.
ONEOK’s five-year rate includes those flat years, so a fairer test is each dividend’s pace now. ONEOK’s dividend rose 4.0% in fiscal 2025, against 3.3% at Enterprise. Even then, Enterprise pays about $1,207 more over 10 years, and ONEOK’s income wouldn’t pass it for more than 30 years.
Enterprise can keep its pace, too: analysts expect its coverage to rise to 1.89x, and management ties its raises to cash flow per unit.
ONEOK still has a strong case. Its coverage is the wider of the two, its guidance is going up, and management is talking openly about potential dividend increases. It’s just that a 1.2-point yield head start is a lot to make up. Enterprise’s bigger check also comes with a sturdier balance sheet and decades of raises behind it.
Of course, ONEOK has room to raise faster than 4% a year, and if it does, that gap starts to close. Its next dividend announcement is the one to watch.
So what is Enterprise Products Partners stock actually worth?
TIKR lets you forecast the future price of any stock in less than a minute. Just enter a few assumptions into TIKR’s valuation model and see what Enterprise Products Partners could be worth. Start from Wall Street consensus estimates, or adjust the inputs to reflect your own view of the business. It’s free to use.
Value Enterprise Products Partners for free
Disclaimer:
Please note that the articles on TIKR are not intended to serve as investment or financial advice from TIKR or our content team, nor are they recommendations to buy or sell any stocks. We create our content based on TIKR Terminal’s investment data and analysts’ estimates. Our analysis might not include recent company news or important updates. TIKR has no position in any of the stocks mentioned. Thank you for reading, and happy investing!
Source: www.tikr.com — article syndicated from the publisher’s feed; all rights remain with the original publisher.

